Back to OSCAM JSF v2 New Features
Uncertainty Tool Changes
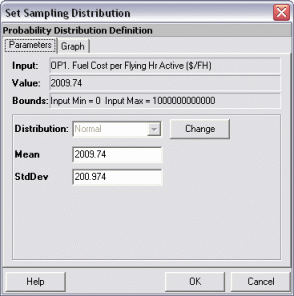
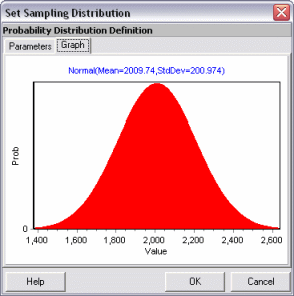
The Uncertainty Tool has been extended to allow more than 20 inputs to be selected. It also now allows a variety of probability distributions to be used. To help in the selection of a probability distribution a graphical display will show the shape of the distribution for the selected parameter values. The input data for an Uncertainty run is now saved as part of the input data record rather than the workspace.
The Probability Distributions
Parameters and Graph


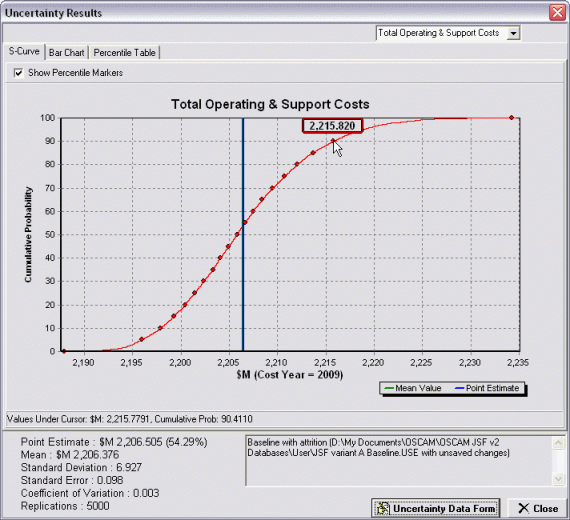
The Uncertainty results now allow S-Curves to be viewed for all of the first level output cost items. The view can be selected from the drop-down box in the top-right corner. This can be done without having to re-run the trials. The S-Curve graph has the option of showing 5% markers, making it easier to read values from the graph. There is also an extra tab showing a table of 5th percentile values.
Uncertainty Results S-Curve

View a demonstration of the Uncertainty Tool
If you have Flash installed you can View the Tutorial (opens in new window).If you do not have Flash installed you can Download the Tutorial and play the .exe file.